With baseball season already a month in I thought it would be appropriate to throw a baseball post in the mix (Get it….Throw?). For this analysis I am going to explore the shift in the balance of power between pitchers and the batters. I got this idea from playing MLB The Show 2015 (PS4 Video Game) Franchise Mode. If you were to simulate a baseball season in Franchise Mode, the end of season statistics are heavily skewed toward the pitcher. I observed multiple pitchers break the 300 Strikeout plateau and win multiple MVPs (Clayton Kershaw) every season I simulated. Now, if you are new to baseball statistics, 300 strikeouts a season and a pitcher winning the MVP award does not happen often. Since MLB The Show 2015 models its game after real life baseball, this led me to investigate whether the balance of power has tipped heavily towards the pitcher. I used R for all the graphs and analysis you will see below.
Back in the 90’s and early 2000’s , homeruns brought much offensive excitement to baseball. It was safe to say that batters had the upper hand. Let’s take a look and see if that is still the case:

As it appears, homeruns are on a downward trajectory from the early 2000’s. However, homeruns are only one aspect of the offense. Let’s take a look at slugging percentage and on-base percentage(shout out to all you Moneyball Fans). Slugging percentage is the measure of the power of a hitter. It is calculated as total number of bases divided by plate appearances. On-base percentage is the measure of how often a batter reaches on base and is calculated by times on base divided by plate appearances.
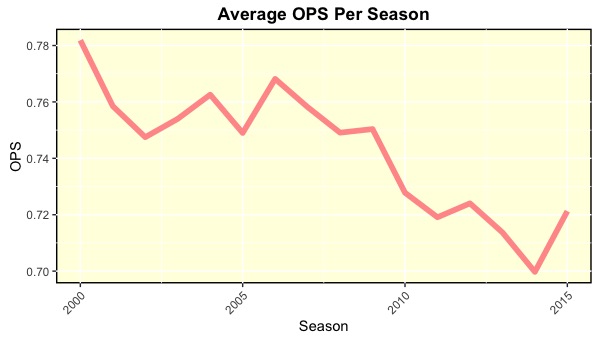
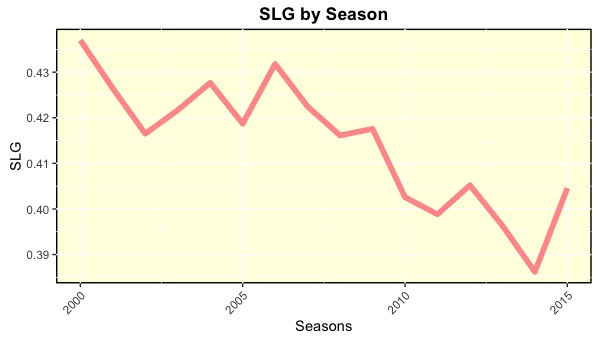
As you can see, both statistics are also downward sloping, thus indicating that overall hitting statistics are down. Does this mean that pitchers are dominating? First, let us CONFIRM that overall offense is down by looking at two more offensive statistics, batting average and runs scored.
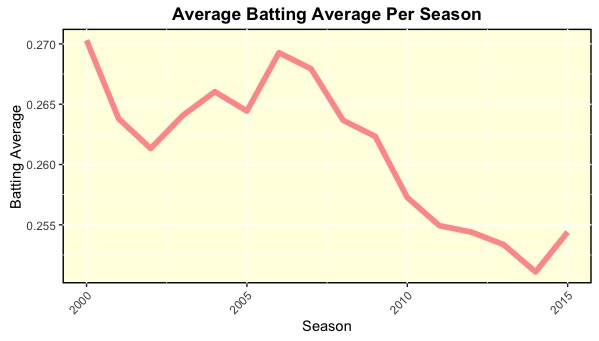
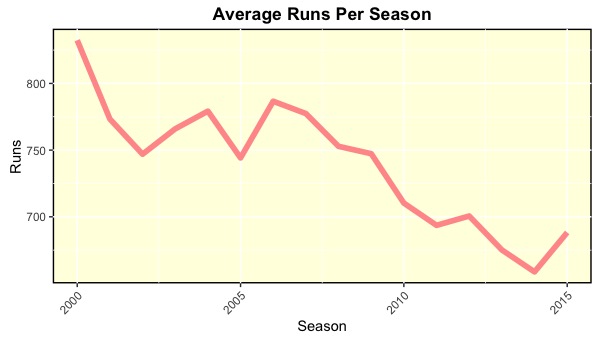
Both as well are downward sloping, so we can confirm that batters are not as effective or as dominant as they once was. However, have pitchers been dominating these hitters that much to see such a decline? Let’s take a look at some pitching statistics such as ERA, WHIP and Strikeouts. ERA is the mean of earned runs given by a pitcher per nine innings pitched. WHIP is calculated by adding the number of walks and hits allowed and dividing it by the sum of innings pitched.
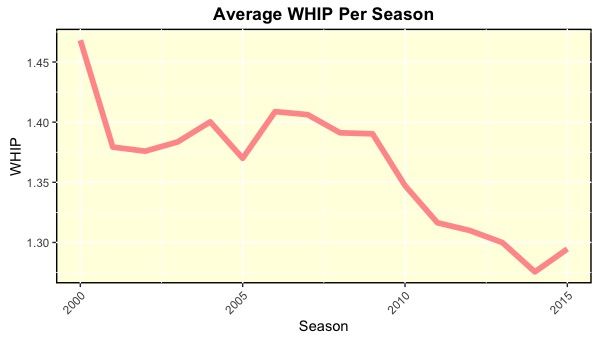
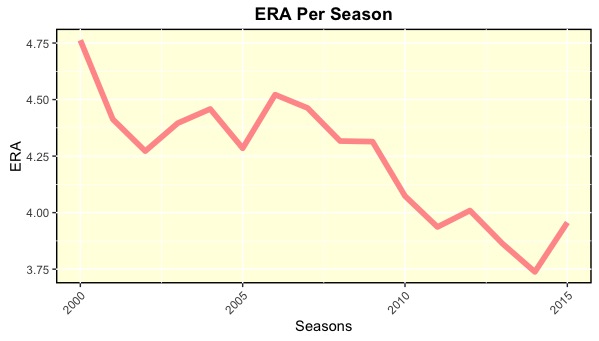
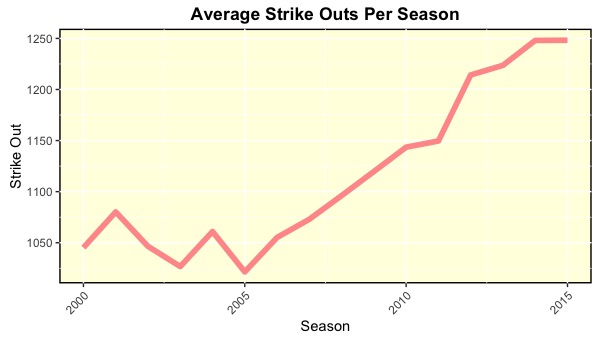
Here you see that pitchers are allowing less runs, striking out more opposing hitters, and have a lower WHIP. This indicates that pitchers are much more dominant than they used to be.
Conclusion
We can safely conclude that pitchers are more dominant in baseball today due to the downward slope in all the highlighted offensive categories and the improvement in all highlighted pitching categories.
There are many reasons for this. The two that are most prevalent are the end of the steroid era and the rise of hard throwers. Home run numbers being much lower than they used to be which can be a result of baseball strict drug policy against steroids(helps batters hit home runs). This causes a domino effect as home run numbers being down correlates to overall run scored being down as well, which happens to be the best statistic to use to characterize hitters and offense. On the pitcher side, the number of strikeouts increasing can be due to the increase of hard throwers in baseball. Although we did not look at any statistics that explicitly say pitchers are throwing harder, we can safely say that more batters are swinging and missing. It would be interesting to see if the swing and miss rate is up against fastballs as compared to the early 2000’s.
Bonus
Let’s take a look at the average ages of pitchers and batters.
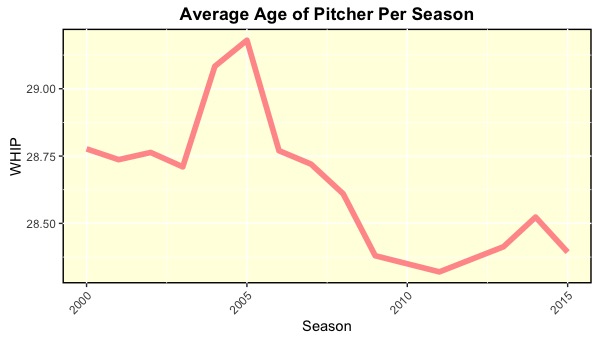
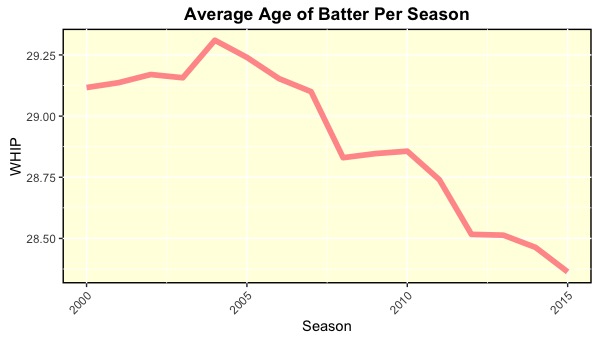
This shows that the league itself is getting much younger. Get ready for a whole new era of baseball, one where pitchers dominate and put up numbers that win MVP awards. Maybe MLB The Show 2015 was on to something.