
If you are an avid Bachelor Fan you probably have a lot to say regarding the dates, the people, even the show itself. Many people take to the Twitter airways to express their comments and feelings throughout the show. Knowing this, I thought it would be fun to scrape tweets, score them, and track the positive and negative reactions throughout an episode aired on 2/29. All the manipulation and data scraping I did was done using R. Below is a short slide show for easier interpretation!

- Here is just a slide if you are not already familiar with the show itself!
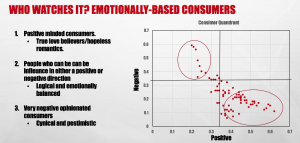
- Here I was able to calculate the rate of positive and negative tweets per twitter user, place it on a scatter plot, and organize them into quadrants.
- There are 4 quadrants:
- Those on the bottom right are people that have many positives things to say about things and are barely critical. (Those romantics….or your grandma…)
- Those on the bottom left have not much to say (positive or negative) regarding the situation. (The quiet one in the group.)
- Those on the top left are highly critical and tend not to give positive feedback. (The jealous, cynical or very critical person)
- Those on the top right have a tendency to throw out positive and negative comments at a fast rate. (People we tell to “shut up and watch the show!”)
- Im sure we can all think of people that fit these descriptions!
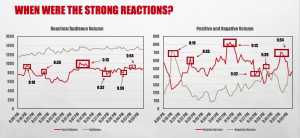
- Here are line graphs of tweet volumes (number of tweets). Here I am trying to highlight the exact moments of the show that these spikes occurred.
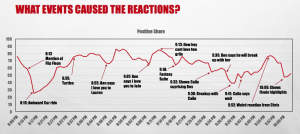
- Here is a line graph of the positive mentions (positive share). Here I prove that each spike is related to a certain event that occurred on the show.
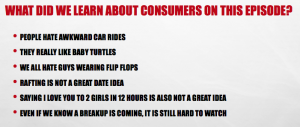
- By matching these events with the dips and spikes I was able to come to the conclusions listed below:
How did I do this?
- Set up R to scrape tweets every 2 minutes regarding the Bachelor. Here’s a link for the package I used to do so: https://cran.r-project.org/web/packages/twitteR/twitteR.pdf
- Create a function on R that can score the tweets based on words that are in them. (You can get creative or search for one!)
- Pass the collected tweets through the function.
- I attached the code I used for my analysis at the bottom of this post.
As you can tell, there is definitely a correlation with spikes in the data and the events that occurred on the show. Taking note of this, there are some cool generalizations you can make about the population that watches the Bachelor or people in general! If you have any more questions about how I created this, feel free to reach out!